★모평균 , 모비율의 차에 대한 신뢰구간★모비율에 대한 오차한계 및 신뢰구간★기초통계학-[연습문제 -10]
16. 2014년에 초,중,고 학생 116000명을 대상으로 우리나라 통일에 대해 조사한 결과, '통일이 필요하다' 라는 응답이 53.5%로 나타났다. 통일이 필요하다고 생각하는 초.중.고 학생의 비율에 대한 95% 신뢰구간을 구하라.
n = 116000
p = 0.535

x = np.arange(-5,5 , .001)

fig = plt.figure(figsize=(15,8))

ax = sns.lineplot(x , stats.norm.pdf(x, loc=0 , scale =1)) #정의역 범위 , 평균 = 0 , 표준편차 =1 인 정규분포 플롯

trust = 95 #신뢰구간

# z_1 = round((0.05) / math.sqrt( 0.0018532 ) ,2)
# # z_2 = round((34.5 - 35) / math.sqrt(5.5**2 / 25) , 2)
z_1 = round(scipy.stats.norm.ppf(1 - (1-(trust/100))/2) ,3 )

ax.fill_between(x, stats.norm.pdf(x, loc=0 , scale =1) , 0 , where = (x<=z_1) & (x>=-z_1) , facecolor = 'skyblue') # x값 , y값 , 0 , x<=0 인곳 , 색깔


area = scipy.stats.norm.cdf(z_1) - scipy.stats.norm.cdf(-z_1)
plt.annotate('' , xy=(0, .1), xytext=(2 , .1)  , arrowprops = dict(facecolor = 'black'))

ax.vlines(x= z_1, ymin= 0 , ymax= stats.norm.pdf(z_1, loc=0 , scale =1) , color = 'black' , linestyle ='solid' , label ='{}'.format(2))
ax.vlines(x= -z_1, ymin= 0 , ymax= stats.norm.pdf(-z_1, loc=0 , scale =1) , color = 'black' , linestyle ='solid' , label ='{}'.format(2))

ax.text(2 , .1, f'P({-z_1}<=Z<={z_1}) : {round(area,4)}',fontsize=15)


# print((z_1 * STDS / math.sqrt(len(A))))

# STDS = round(math.sqrt(4),3) #모표준편차
RATIO = 0.535
n = 116000


ax.text(2 , .35,  r'$\sqrt{\widehat{p}\widehat{q}} = $' + f'{round(math.sqrt(RATIO * (1-RATIO)),3)}\n'  + r'$\sqrt{n} = $' + f'{round(math.sqrt(n),2)}',fontsize=15)


ax.text(2 , .3,  r'신뢰구간 L = $2*{%.3f}\sqrt{\dfrac{\widehat{p}\widehat{q}}{n}} = $' % z_1 + f'{round(2* z_1 * math.sqrt(RATIO * (1-RATIO) / n),3)}',fontsize=15)

ax.text(2 , .25,  r'오차한계 = ${%.3f}\sqrt{\dfrac{\widehat{p}\widehat{q}}{n}} = $' % z_1 + f'{round( z_1 * math.sqrt(RATIO * (1-RATIO) / n),3)}',fontsize=15)

ax.text(-5.5 , .35,  r'표준오차 = $\sqrt{\dfrac{\widehat{p}\widehat{q}}{{n}}} = $' + f'{round( math.sqrt(RATIO * (1-RATIO) / n),3)}',fontsize=15)

ax.text(2 , .15, f'신뢰구간 모평균에 대한 {trust}% : \n' + r'$(\widehat{p}$' +f'-{z_1}' + r'$\sqrt{\dfrac{\widehat{p}\widehat{q}}{n}}$' +' , '+ r'$\widehat{p}$' +f'+ {z_1}' + r'$\sqrt{\dfrac{\widehat{p}\widehat{q}}{n}})$ = ' + f'({round(RATIO - z_1*math.sqrt(RATIO*(1-RATIO) /n),4)} , {round(RATIO + z_1*math.sqrt(RATIO*(1-RATIO) /n),4)})' ,fontsize=15)
print(z_1)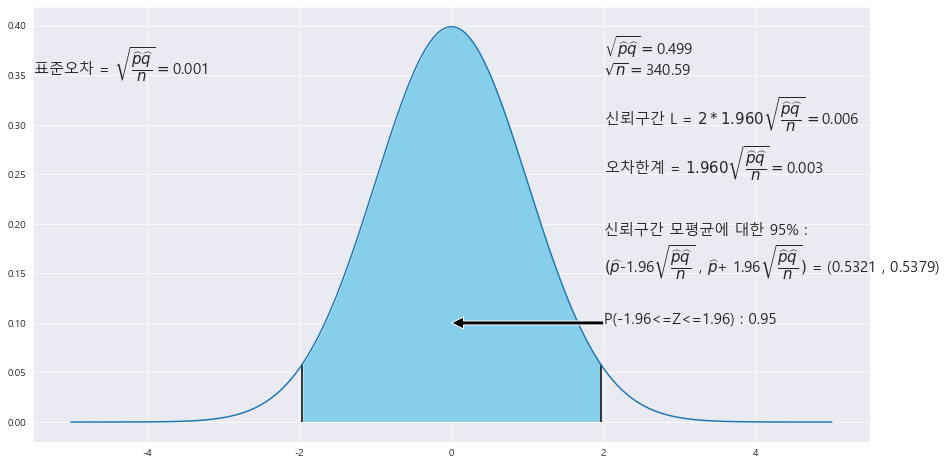
신뢰구간 = (0.5321 , 0.5379)
17. 전체적으로 적자 가구의 비율은 23.0% 이다. , 서민층과 중산층의 적자 가구의 비율은 각각 26.8%와 19.8%이다.
1>우리나라의 적자 가구 비율에 대한 95%의 신뢰구간을 구하라(단, 표본의 크기는 14950가구)
p = 0.23
n = 14950
x = np.arange(-5,5 , .001)

fig = plt.figure(figsize=(15,8))

ax = sns.lineplot(x , stats.norm.pdf(x, loc=0 , scale =1)) #정의역 범위 , 평균 = 0 , 표준편차 =1 인 정규분포 플롯

trust = 95 #신뢰구간

# z_1 = round((0.05) / math.sqrt( 0.0018532 ) ,2)
# # z_2 = round((34.5 - 35) / math.sqrt(5.5**2 / 25) , 2)
z_1 = round(scipy.stats.norm.ppf(1 - (1-(trust/100))/2) ,3 )

ax.fill_between(x, stats.norm.pdf(x, loc=0 , scale =1) , 0 , where = (x<=z_1) & (x>=-z_1) , facecolor = 'skyblue') # x값 , y값 , 0 , x<=0 인곳 , 색깔


area = scipy.stats.norm.cdf(z_1) - scipy.stats.norm.cdf(-z_1)
plt.annotate('' , xy=(0, .1), xytext=(2 , .1)  , arrowprops = dict(facecolor = 'black'))

ax.vlines(x= z_1, ymin= 0 , ymax= stats.norm.pdf(z_1, loc=0 , scale =1) , color = 'black' , linestyle ='solid' , label ='{}'.format(2))
ax.vlines(x= -z_1, ymin= 0 , ymax= stats.norm.pdf(-z_1, loc=0 , scale =1) , color = 'black' , linestyle ='solid' , label ='{}'.format(2))

ax.text(2 , .1, f'P({-z_1}<=Z<={z_1}) : {round(area,4)}',fontsize=15)


# print((z_1 * STDS / math.sqrt(len(A))))

# STDS = round(math.sqrt(4),3) #모표준편차
RATIO = 0.23
n = 14950


ax.text(2 , .35,  r'$\sqrt{\widehat{p}\widehat{q}} = $' + f'{round(math.sqrt(RATIO * (1-RATIO)),3)}\n'  + r'$\sqrt{n} = $' + f'{round(math.sqrt(n),2)}',fontsize=15)


ax.text(2 , .3,  r'신뢰구간 L = $2*{%.3f}\sqrt{\dfrac{\widehat{p}\widehat{q}}{n}} = $' % z_1 + f'{round(2* z_1 * math.sqrt(RATIO * (1-RATIO) / n),3)}',fontsize=15)

ax.text(2 , .25,  r'오차한계 = ${%.3f}\sqrt{\dfrac{\widehat{p}\widehat{q}}{n}} = $' % z_1 + f'{round( z_1 * math.sqrt(RATIO * (1-RATIO) / n),3)}',fontsize=15)

ax.text(-5.5 , .35,  r'표준오차 = $\sqrt{\dfrac{\widehat{p}\widehat{q}}{{n}}} = $' + f'{round( math.sqrt(RATIO * (1-RATIO) / n),3)}',fontsize=15)

ax.text(2 , .15, f'신뢰구간 모평균에 대한 {trust}% : \n' + r'$(\widehat{p}$' +f'-{z_1}' + r'$\sqrt{\dfrac{\widehat{p}\widehat{q}}{n}}$' +' , '+ r'$\widehat{p}$' +f'+ {z_1}' + r'$\sqrt{\dfrac{\widehat{p}\widehat{q}}{n}})$ = ' + f'({round(RATIO - z_1*math.sqrt(RATIO*(1-RATIO) /n),4)} , {round(RATIO + z_1*math.sqrt(RATIO*(1-RATIO) /n),4)})' ,fontsize=15)
print(z_1)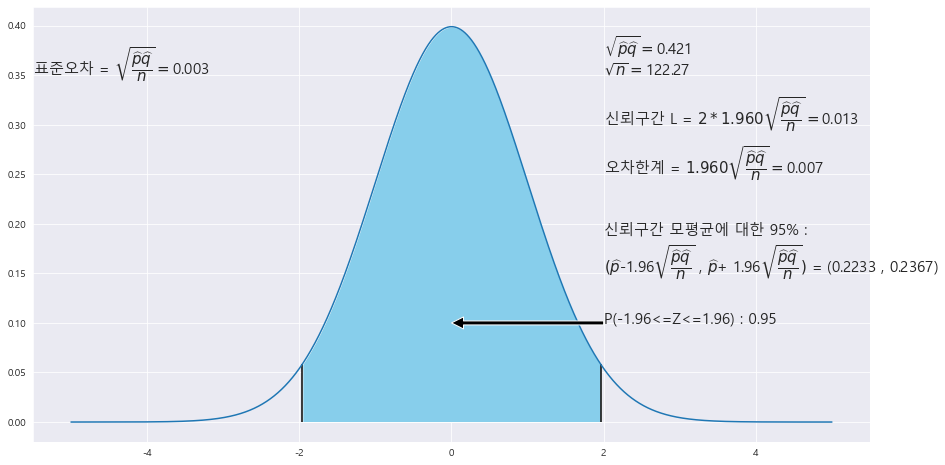
신뢰구간 = (0.2233 , 0.2367)
2>서민층과 중산층의 적자 가구 비율의 차에 대한 95% 신뢰구간을 구하라.(표본의 크기는 48000가구라 가정한다.)
^p1 = 0.268
^p2 = 0.198
n = 48000
x = np.arange(-5,5 , .001)

fig = plt.figure(figsize=(15,8))

ax = sns.lineplot(x , stats.norm.pdf(x, loc=0 , scale =1)) #정의역 범위 , 평균 = 0 , 표준편차 =1 인 정규분포 플롯

trust = 95#신뢰구간

# z_1 = round((0.05) / math.sqrt( 0.0018532 ) ,2)
# # z_2 = round((34.5 - 35) / math.sqrt(5.5**2 / 25) , 2)
z_1 = round(scipy.stats.norm.ppf(1 - (1-(trust/100))/2) ,3 )

ax.fill_between(x, stats.norm.pdf(x, loc=0 , scale =1) , 0 , where = (x<=z_1) & (x>=-z_1) , facecolor = 'skyblue') # x값 , y값 , 0 , x<=0 인곳 , 색깔


area = scipy.stats.norm.cdf(z_1) - scipy.stats.norm.cdf(-z_1)
plt.annotate('' , xy=(0, .1), xytext=(2 , .1)  , arrowprops = dict(facecolor = 'black'))

ax.vlines(x= z_1, ymin= 0 , ymax= stats.norm.pdf(z_1, loc=0 , scale =1) , color = 'black' , linestyle ='solid' , label ='{}'.format(2))
ax.vlines(x= -z_1, ymin= 0 , ymax= stats.norm.pdf(-z_1, loc=0 , scale =1) , color = 'black' , linestyle ='solid' , label ='{}'.format(2))

ax.text(2 , .1, f'P({-z_1}<=Z<={z_1}) : {round(area,4)}',fontsize=15)


p1 = 0.268
p2 = 0.198
A = 48000
B = 48000
ax.text(-5.5 , .25, f'신뢰구간 모비율의 차에 대한 {trust}% : \n' + r'($\left(\widehat{p}_{1} - \widehat{p}_{2}\right)$' +f'-{z_1}' + r'$\sqrt{\dfrac{\widehat{p}_{1}\widehat{q}_{1}}{n}+\dfrac{\widehat{p}_{2}\widehat{q}_{2}}{m}}$' +' , '+ r'$\left(\widehat{p}_{1} - \widehat{p}_{2}\right)$' +f'+ {z_1}' + r'$\sqrt{\dfrac{\widehat{p}_{1}\widehat{q}_{1}}{n}+\dfrac{\widehat{p}_{2}\widehat{q}_{2}}{m}}$) =' + f'\n ({round(p1-p2 - z_1* math.sqrt(p1*(1-p1)/A + p2*(1-p2)/B),4)} , {round(p1-p2 + z_1* math.sqrt(p1*(1-p1)/A + p2*(1-p2)/B),4)} )',fontsize=15)


ax.text(1 , .35, f' 신뢰구간 {trust}% 에 대한 오차 한계( ' +r'$e_{%d}) : $ '% trust + f'\n' + r'${%.3f}\sqrt{\dfrac{\widehat{p}_{1}\widehat{q}_{1}}{n}+\dfrac{\widehat{p}_{2}\widehat{q}_{2}}{m}}$ = '% z_1 + f'{round((z_1)*math.sqrt(p1*(1-p1)/A + p2*(1-p2)/B),3)} ' , fontsize= 15)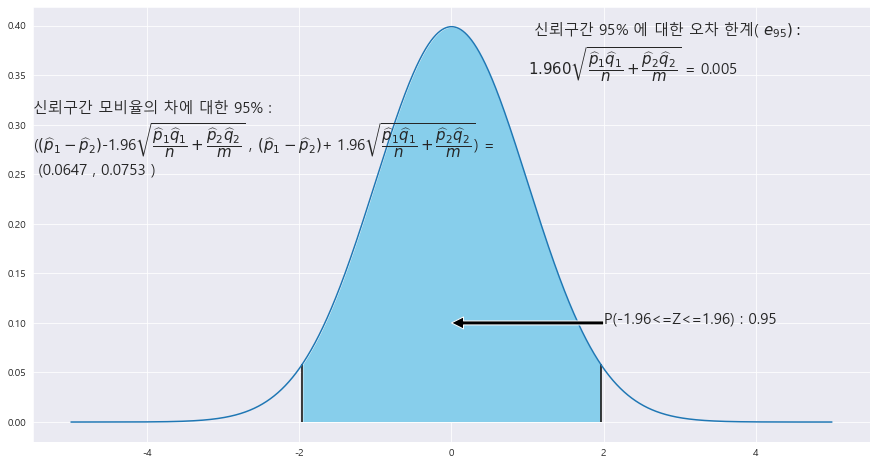
신뢰구간 = (0.0647 , 0.0753)
18. 서울지역 고등학교 남학생 260명과 여학생 250명을 표본조사
㉠ 주 1회 이상 아침 식사를 결식하는 비율이 남학생 41.1% , 여학생 44.1% 이다.
㉡ 자신이 건강하다고 생각하는 비율은 남학생 41.1% , 여학생 44.1% 이다.
㉢ 평균 키는 남학생이 174.1cm , 여학생이 161.6cm 이다.
㉣ 평균 몸무게는 남학생이 65.9kg, 여학생이 52.5kg이다.
1) 서울 지역 남학생의 평균 키와 여학생의 평균 키의 차에 대한 95% 신뢰구간을 구하라.(남학생과 여학생의 키에 대한 표준편차는 각각 5cm , 3cm 이고 정규분포를 따른다.)
|X = 174.1
|Y = 161.6
n_X = 260
n_Y = 250
o_1 = 5
o_2 = 3
x = np.arange(-5,5 , .001)

fig = plt.figure(figsize=(15,8))

ax = sns.lineplot(x , stats.norm.pdf(x, loc=0 , scale =1)) #정의역 범위 , 평균 = 0 , 표준편차 =1 인 정규분포 플롯

trust = 95#신뢰구간

# z_1 = round((0.05) / math.sqrt( 0.0018532 ) ,2)
# # z_2 = round((34.5 - 35) / math.sqrt(5.5**2 / 25) , 2)
z_1 = round(scipy.stats.norm.ppf(1 - (1-(trust/100))/2) ,3 )

ax.fill_between(x, stats.norm.pdf(x, loc=0 , scale =1) , 0 , where = (x<=z_1) & (x>=-z_1) , facecolor = 'skyblue') # x값 , y값 , 0 , x<=0 인곳 , 색깔


area = scipy.stats.norm.cdf(z_1) - scipy.stats.norm.cdf(-z_1)
plt.annotate('' , xy=(0, .1), xytext=(2 , .1)  , arrowprops = dict(facecolor = 'black'))

ax.vlines(x= z_1, ymin= 0 , ymax= stats.norm.pdf(z_1, loc=0 , scale =1) , color = 'black' , linestyle ='solid' , label ='{}'.format(2))
ax.vlines(x= -z_1, ymin= 0 , ymax= stats.norm.pdf(-z_1, loc=0 , scale =1) , color = 'black' , linestyle ='solid' , label ='{}'.format(2))

ax.text(2 , .1, f'P({-z_1}<=Z<={z_1}) : {round(area,4)}',fontsize=15)

ax.text(-5.5 , .25, f'신뢰구간 모평균에 대한 {trust}% : \n' + r'$\left( \overline{x}-\overline{y}\right)$' +f'-{z_1}' + r'$\sqrt{\dfrac{\sigma_{1}^{2}}{n}+\dfrac{\sigma_{2} ^{2}}{m}}$' +' , '+ r'$\left( \overline{x}-\overline{y}\right)$' +f'+ {z_1}' + r'$\sqrt{\dfrac{\sigma_{1}^{2}}{n}+\dfrac{\sigma_{2} ^{2}}{m}}$',fontsize=15)


MEANS_A = 174.1
MEANS_B = 161.6
Var_A = 5**2
Var_B = 3**2
STDS_A = round(math.sqrt(Var_A),2)
STDS_B = round(math.sqrt(Var_B) , 2)
n_A = 260
n_B = 250

ax.text(-5.5 , .2 , f'표준오차 :' + r'$\sqrt{\dfrac{\sigma_{1}^{2}}{n}+\dfrac{\sigma_{2} ^{2}}{m}}$' + f'= {round(math.sqrt(Var_A/n_A + Var_B/n_B),3)}' , fontsize = 15)

ax.text(2 , .35,  r'$\overline{X}_{1}$ = ' +f'{MEANS_A}'+   r' , $\overline{X}_{2}$ = ' +f'{MEANS_B}\n' + r'$\sigma_{1} = $' + f'{STDS_A}' + r', $\sigma_{2} = $' + f'{STDS_B}\n' + r'$\sqrt{n} = $' + f'{round(math.sqrt(n_A),3)}' + r', $\sqrt{m} = $' + f'{round(math.sqrt(n_B),3)}',fontsize=15)


b  = r'N($\overline{X}-\overline{Y} = $' + f'{MEANS_A - MEANS_B}, ' + r'$\sqrt{\dfrac{\sigma_{1}^{2}}{n}+\dfrac{\sigma_{2} ^{2}}{m}}$ = '+f'{round(math.sqrt(Var_A/n_A + Var_B/n_B) , 3)})'

plt.legend([b] , fontsize = 15 , loc='upper left')
ax.text(-5.5 , .15,  r'오차한계 = ${%.3f}\sqrt{\dfrac{\sigma_{1}^{2}}{n}+\dfrac{\sigma_{2} ^{2}}{m}} = $' % z_1 + f'{z_1 * round(math.sqrt(Var_A/n_A + Var_B/n_B) , 3)}',fontsize=15)

ax.text(2 , .25, f'모평균의 차에 대한 신뢰구간 {trust}% , \n' + r'신뢰구간 L = $2*{%.3f}\dfrac{\sigma}{\sqrt{n}} = $' % z_1   +f': \n' + f'({round((MEANS_A-MEANS_B) - (z_1)*math.sqrt(Var_A/n_A + Var_B/n_B),3)} ~ {round((MEANS_A-MEANS_B) + (z_1)*math.sqrt(Var_A/n_A + Var_B/n_B),3)})' , fontsize= 15)
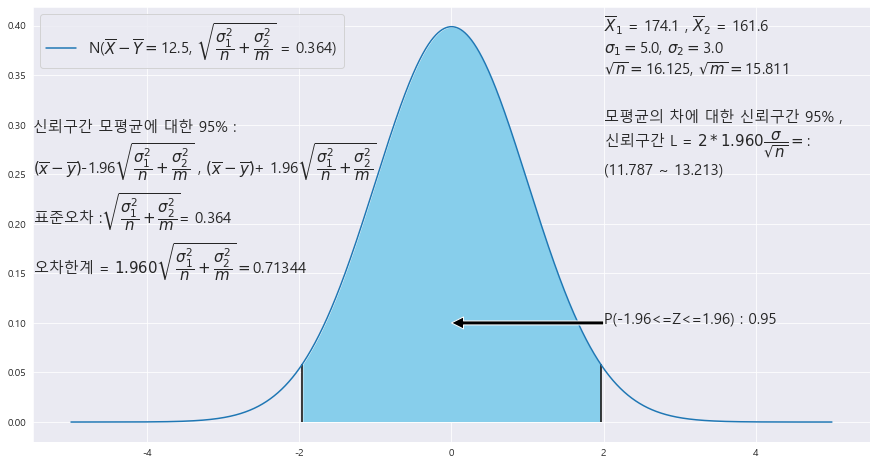
신뢰구간 = (11.787 , 13.213)
2) 서울 지역 남학생의 평균 몸무게와 여학생의 평균 몸무게의 차에 대한 99% 신뢰구간을 구하라.(남학생과 여학생의 키에 대한 표준편차는 각각 4.5kg , 2.5kg 이고 정규분포를 따른다.)
|X = 65.9
|Y = 52.5
n_X = 260
n_Y = 250
o_1 = 4.5
o_2 = 2.5
x = np.arange(-5,5 , .001)

fig = plt.figure(figsize=(15,8))

ax = sns.lineplot(x , stats.norm.pdf(x, loc=0 , scale =1)) #정의역 범위 , 평균 = 0 , 표준편차 =1 인 정규분포 플롯

trust = 99#신뢰구간

# z_1 = round((0.05) / math.sqrt( 0.0018532 ) ,2)
# # z_2 = round((34.5 - 35) / math.sqrt(5.5**2 / 25) , 2)
z_1 = round(scipy.stats.norm.ppf(1 - (1-(trust/100))/2) ,3 )

ax.fill_between(x, stats.norm.pdf(x, loc=0 , scale =1) , 0 , where = (x<=z_1) & (x>=-z_1) , facecolor = 'skyblue') # x값 , y값 , 0 , x<=0 인곳 , 색깔


area = scipy.stats.norm.cdf(z_1) - scipy.stats.norm.cdf(-z_1)
plt.annotate('' , xy=(0, .1), xytext=(2 , .1)  , arrowprops = dict(facecolor = 'black'))

ax.vlines(x= z_1, ymin= 0 , ymax= stats.norm.pdf(z_1, loc=0 , scale =1) , color = 'black' , linestyle ='solid' , label ='{}'.format(2))
ax.vlines(x= -z_1, ymin= 0 , ymax= stats.norm.pdf(-z_1, loc=0 , scale =1) , color = 'black' , linestyle ='solid' , label ='{}'.format(2))

ax.text(2 , .1, f'P({-z_1}<=Z<={z_1}) : {round(area,4)}',fontsize=15)

ax.text(-5.5 , .25, f'신뢰구간 모평균에 대한 {trust}% : \n' + r'$\left( \overline{x}-\overline{y}\right)$' +f'-{z_1}' + r'$\sqrt{\dfrac{\sigma_{1}^{2}}{n}+\dfrac{\sigma_{2} ^{2}}{m}}$' +' , '+ r'$\left( \overline{x}-\overline{y}\right)$' +f'+ {z_1}' + r'$\sqrt{\dfrac{\sigma_{1}^{2}}{n}+\dfrac{\sigma_{2} ^{2}}{m}}$',fontsize=15)


MEANS_A = 65.9
MEANS_B = 52.5
Var_A = 4.5**2
Var_B = 2.5**2
STDS_A = round(math.sqrt(Var_A),2)
STDS_B = round(math.sqrt(Var_B) , 2)
n_A = 260
n_B = 250

ax.text(-5.5 , .2 , f'표준오차 :' + r'$\sqrt{\dfrac{\sigma_{1}^{2}}{n}+\dfrac{\sigma_{2} ^{2}}{m}}$' + f'= {round(math.sqrt(Var_A/n_A + Var_B/n_B),3)}' , fontsize = 15)

ax.text(2 , .35,  r'$\overline{X}_{1}$ = ' +f'{MEANS_A}'+   r' , $\overline{X}_{2}$ = ' +f'{MEANS_B}\n' + r'$\sigma_{1} = $' + f'{STDS_A}' + r', $\sigma_{2} = $' + f'{STDS_B}\n' + r'$\sqrt{n} = $' + f'{round(math.sqrt(n_A),3)}' + r', $\sqrt{m} = $' + f'{round(math.sqrt(n_B),3)}',fontsize=15)


b  = r'N($\overline{X}-\overline{Y} = $' + f'{MEANS_A - MEANS_B}, ' + r'$\sqrt{\dfrac{\sigma_{1}^{2}}{n}+\dfrac{\sigma_{2} ^{2}}{m}}$ = '+f'{round(math.sqrt(Var_A/n_A + Var_B/n_B) , 3)})'

plt.legend([b] , fontsize = 15 , loc='upper left')
ax.text(-5.5 , .15,  r'오차한계 = ${%.3f}\sqrt{\dfrac{\sigma_{1}^{2}}{n}+\dfrac{\sigma_{2} ^{2}}{m}} = $' % z_1 + f'{z_1 * round(math.sqrt(Var_A/n_A + Var_B/n_B) , 3)}',fontsize=15)

ax.text(2 , .25, f'모평균의 차에 대한 신뢰구간 {trust}% , \n' + r'신뢰구간 L = $2*{%.3f}\dfrac{\sigma}{\sqrt{n}} = $' % z_1   +f': \n' + f'({round((MEANS_A-MEANS_B) - (z_1)*math.sqrt(Var_A/n_A + Var_B/n_B),3)} ~ {round((MEANS_A-MEANS_B) + (z_1)*math.sqrt(Var_A/n_A + Var_B/n_B),3)})' , fontsize= 15)
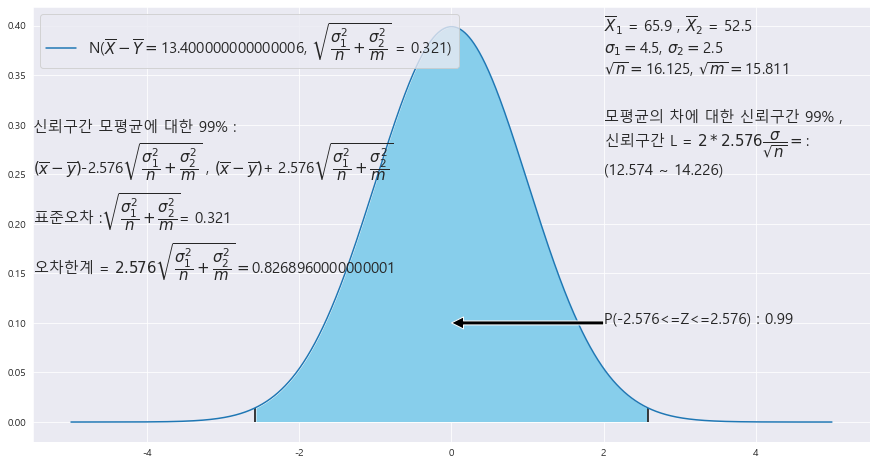
신뢰구간 = (12.574 , 14.226)
3) 주 1회 이상 아침 식사를 결식하는 서울 지역 고등학교 여학생의 비율과 남학생의 비율의 차에 대한 90% 신뢰구간을 구하라.
^p1= 0.411
^p2 = 0.441
n_X = 260
n_Y = 250
x = np.arange(-5,5 , .001)

fig = plt.figure(figsize=(15,8))

ax = sns.lineplot(x , stats.norm.pdf(x, loc=0 , scale =1)) #정의역 범위 , 평균 = 0 , 표준편차 =1 인 정규분포 플롯

trust = 90#신뢰구간

# z_1 = round((0.05) / math.sqrt( 0.0018532 ) ,2)
# # z_2 = round((34.5 - 35) / math.sqrt(5.5**2 / 25) , 2)
z_1 = round(scipy.stats.norm.ppf(1 - (1-(trust/100))/2) ,3 )

ax.fill_between(x, stats.norm.pdf(x, loc=0 , scale =1) , 0 , where = (x<=z_1) & (x>=-z_1) , facecolor = 'skyblue') # x값 , y값 , 0 , x<=0 인곳 , 색깔


area = scipy.stats.norm.cdf(z_1) - scipy.stats.norm.cdf(-z_1)
plt.annotate('' , xy=(0, .1), xytext=(2 , .1)  , arrowprops = dict(facecolor = 'black'))

ax.vlines(x= z_1, ymin= 0 , ymax= stats.norm.pdf(z_1, loc=0 , scale =1) , color = 'black' , linestyle ='solid' , label ='{}'.format(2))
ax.vlines(x= -z_1, ymin= 0 , ymax= stats.norm.pdf(-z_1, loc=0 , scale =1) , color = 'black' , linestyle ='solid' , label ='{}'.format(2))

ax.text(2 , .1, f'P({-z_1}<=Z<={z_1}) : {round(area,4)}',fontsize=15)


p1 = 0.411
p2 = 0.441
A = 260
B = 250
ax.text(-5.5 , .25, f'신뢰구간 모비율의 차에 대한 {trust}% : \n' + r'($\left(\widehat{p}_{1} - \widehat{p}_{2}\right)$' +f'-{z_1}' + r'$\sqrt{\dfrac{\widehat{p}_{1}\widehat{q}_{1}}{n}+\dfrac{\widehat{p}_{2}\widehat{q}_{2}}{m}}$' +' , '+ r'$\left(\widehat{p}_{1} - \widehat{p}_{2}\right)$' +f'+ {z_1}' + r'$\sqrt{\dfrac{\widehat{p}_{1}\widehat{q}_{1}}{n}+\dfrac{\widehat{p}_{2}\widehat{q}_{2}}{m}}$) =' + f'\n ({round(p1-p2 - z_1* math.sqrt(p1*(1-p1)/A + p2*(1-p2)/B),4)} , {round(p1-p2 + z_1* math.sqrt(p1*(1-p1)/A + p2*(1-p2)/B),4)} )',fontsize=15)


ax.text(1 , .35, f' 신뢰구간 {trust}% 에 대한 오차 한계( ' +r'$e_{%d}) : $ '% trust + f'\n' + r'${%.3f}\sqrt{\dfrac{\widehat{p}_{1}\widehat{q}_{1}}{n}+\dfrac{\widehat{p}_{2}\widehat{q}_{2}}{m}}$ = '% z_1 + f'{round((z_1)*math.sqrt(p1*(1-p1)/A + p2*(1-p2)/B),3)} ' , fontsize= 15)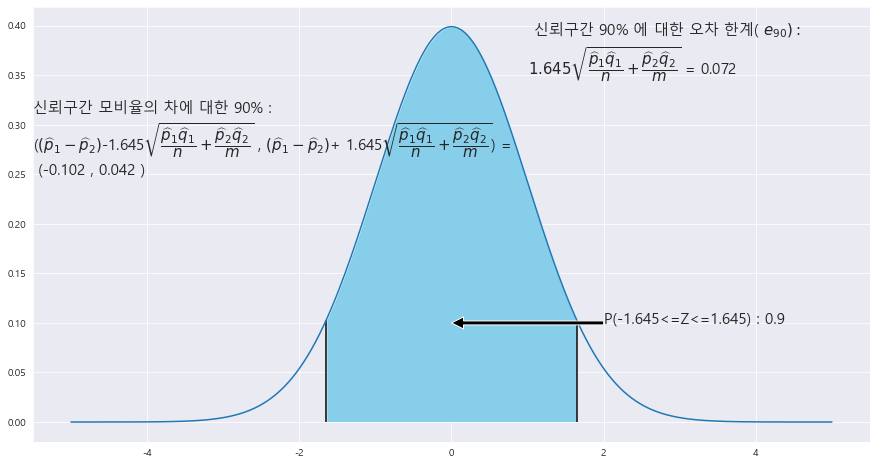
신뢰구간 = (-0.102 , 0.042)
4) 건강하다고 생각하는 서울 지역 남학생의 비율과 여학생의 비율의차에 대한 95% 신뢰구간을 구하라.
^p1 = 0.689
^p2 = 0.556
n_X = 260
n_Y = 250
x = np.arange(-5,5 , .001)

fig = plt.figure(figsize=(15,8))

ax = sns.lineplot(x , stats.norm.pdf(x, loc=0 , scale =1)) #정의역 범위 , 평균 = 0 , 표준편차 =1 인 정규분포 플롯

trust = 95#신뢰구간

# z_1 = round((0.05) / math.sqrt( 0.0018532 ) ,2)
# # z_2 = round((34.5 - 35) / math.sqrt(5.5**2 / 25) , 2)
z_1 = round(scipy.stats.norm.ppf(1 - (1-(trust/100))/2) ,3 )

ax.fill_between(x, stats.norm.pdf(x, loc=0 , scale =1) , 0 , where = (x<=z_1) & (x>=-z_1) , facecolor = 'skyblue') # x값 , y값 , 0 , x<=0 인곳 , 색깔


area = scipy.stats.norm.cdf(z_1) - scipy.stats.norm.cdf(-z_1)
plt.annotate('' , xy=(0, .1), xytext=(2 , .1)  , arrowprops = dict(facecolor = 'black'))

ax.vlines(x= z_1, ymin= 0 , ymax= stats.norm.pdf(z_1, loc=0 , scale =1) , color = 'black' , linestyle ='solid' , label ='{}'.format(2))
ax.vlines(x= -z_1, ymin= 0 , ymax= stats.norm.pdf(-z_1, loc=0 , scale =1) , color = 'black' , linestyle ='solid' , label ='{}'.format(2))

ax.text(2 , .1, f'P({-z_1}<=Z<={z_1}) : {round(area,4)}',fontsize=15)


p1 = 0.689
p2 = 0.556
A = 260
B = 250
ax.text(-5.5 , .25, f'신뢰구간 모비율의 차에 대한 {trust}% : \n' + r'($\left(\widehat{p}_{1} - \widehat{p}_{2}\right)$' +f'-{z_1}' + r'$\sqrt{\dfrac{\widehat{p}_{1}\widehat{q}_{1}}{n}+\dfrac{\widehat{p}_{2}\widehat{q}_{2}}{m}}$' +' , '+ r'$\left(\widehat{p}_{1} - \widehat{p}_{2}\right)$' +f'+ {z_1}' + r'$\sqrt{\dfrac{\widehat{p}_{1}\widehat{q}_{1}}{n}+\dfrac{\widehat{p}_{2}\widehat{q}_{2}}{m}}$) =' + f'\n ({round(p1-p2 - z_1* math.sqrt(p1*(1-p1)/A + p2*(1-p2)/B),4)} , {round(p1-p2 + z_1* math.sqrt(p1*(1-p1)/A + p2*(1-p2)/B),4)} )',fontsize=15)


ax.text(1 , .35, f' 신뢰구간 {trust}% 에 대한 오차 한계( ' +r'$e_{%d}) : $ '% trust + f'\n' + r'${%.3f}\sqrt{\dfrac{\widehat{p}_{1}\widehat{q}_{1}}{n}+\dfrac{\widehat{p}_{2}\widehat{q}_{2}}{m}}$ = '% z_1 + f'{round((z_1)*math.sqrt(p1*(1-p1)/A + p2*(1-p2)/B),3)} ' , fontsize= 15)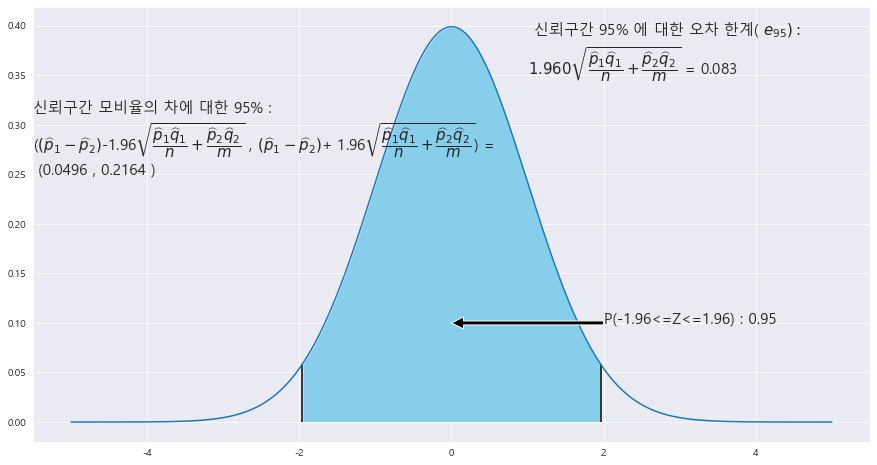
신뢰구간 = (0.0496 , 0.2164)
출처 : [쉽게 배우는 생활속의 통계학] [북스힐 , 이재원]
※혼자 공부 정리용
'기초통계 > 대표본 추정' 카테고리의 다른 글
| ★비율을 알고 있을때와 모를때의 표본의 크기★모표준편차 1개가 주어질때 표본의 크기 구하기★모비율의 차에 대한 신뢰구간★기초통계학-[연습문제 -11] (0) | 2023.01.12 |
|---|---|
| ★모평균, 모비율간 차에 대한 오차한계 및 신뢰구간★두 모평균,모비율의 차에 대한 점추정★기초통계학-[연습문제 -09] (0) | 2023.01.12 |
| ★최소분산불편추정량★편의추정량★불편추정량★점추정량★기초통계학-[연습문제 -08] (0) | 2023.01.12 |
| ★모비율,모평균에 대한 오차한계★오차한계(신뢰구간의 절반)★기초통계학-[연습문제 -07] (0) | 2023.01.12 |
| ★모평균의 차에 대한 신뢰구간★모비율에 대한 표본크기 구하기★표본의 크기★기초통계학-[대표본 추정 -06] (0) | 2023.01.12 |