★가중평균, 표본평균★기초통계학-[Chapter03 - 02]
2022. 12. 2. 11:12
728x90
반응형
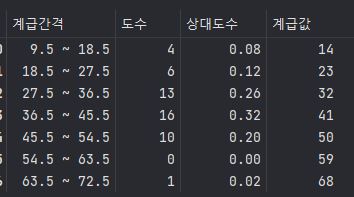
EX) 50명의 청소년들이 일주일 동안 인터넷을 사용한 시간 조사결과
A  ='29 30 49 21 39 38 15 39 48 41 50 38 33 40 51 29 31 42 29 69 37 20 49 40 10 49 49 49 35 45 22 45 20 45 30 41 40 38 10 31 47 19 31 21 41 46 28 29 18 28'

A = list(map(int, A.split(' ')))
A
[29, 30, 49, 21, 39, 38, 15, 39, 48 · · · · · · · ·]
bins = np.arange(9.5, 72.5 + 9 , 9)
hist, bins = np.histogram(A, bins)
print(hist)
print(bins)
Steps = []
interval = []
for i in range(len(bins)-1):
    Steps.append(int(bins[i+1] - (9/2)))
    interval.append('{} ~ {}'.format(bins[i] , bins[i+1]))
print(Steps)
print('Steps : {}'.format(Steps)) #계급값
print(interval)
print('interval : {}'.format(interval))
print(len(hist))
print('hist : {}'.format(hist))
print(len(bins))
print('bins : {}'.format(bins))
ratio = []
for i in hist:
    ratio.append(round(i/50 ,2))
print('ratio : {}'.format(ratio))
B = pd.DataFrame({'계급간격' : interval ,'도수' : hist , '상대도수' : ratio, '계급값' : Steps} )
B
1. Matplotlib 히스토그램
fig = plt.figure(figsize=(8,8))
fig.set_facecolor('white')
#ax = plt.plot(figsize=(8,8))
plt.hist(A, bins , rwidth = 0.8 , alpha = 0.5)
plt.title('계급 간격 별 도수 막대그래프')
plt.xlabel('계급간격' , fontsize = 14 , labelpad= 14 ,rotation = 0)
plt.ylabel('도수' , fontsize = 14 , labelpad= 14 ,rotation = 0)
plt.xticks(fontsize = 14)
plt.yticks(fontsize = 14)
2. Seaborn 히스토그램(막대그래프)
fig = plt.figure(figsize=(8,8))
fig.set_facecolor('white')
ax = plt.plot(figsize= (8,8))

ax = sns.barplot(x=B['계급간격'] , y = B['도수'])

for i,txt in enumerate(B['도수']):
    b = txt
    print(b)
    if  b == max(B['도수']):
        ax.text(i, b+0.4, str(txt)+'개' , ha='center' , color = 'red' , fontweight = 'bold' , fontsize=17)
        #어디 막대, 막대기의 위쪽에
    else:
        ax.text(i, b+0.5, str(txt)+'개' , ha='center' , color = 'dimgray' , fontsize=13 , fontweight = 'bold')
3. 도수 분포표에 따른 가중평균
GazungPyeong = []
for i in range(len(B['계급값'])):
    GazungPyeong.append(round(B['계급값'][i] * B['상대도수'][i] ,2))
print(GazungPyeong)
print(sum(GazungPyeong))
모평균 : 35.48
가중평균 : 36.68

==> 왜 가중평균 ? : 자료에 대해 중심위치를 구하는 데 매우 효과적으로 사용
출처 : [쉽게 배우는 생활속의 통계학] [북스힐 , 이재원]
※혼자 공부 정리용
728x90
반응형
'기초통계 > 평균,표준편차,분산' 카테고리의 다른 글
| 경험적규칙★체비쇼프 정리★기초통계학-[Chapter03 - 06] (0) | 2022.12.06 |
|---|---|
| ★distplot , histplot , twinx(), ticker , axvline()★정규분포 그래프★기초통계학-[Chapter03 - 05] (0) | 2022.12.06 |
| ★DDOF = 1★모/표본분산 , 모/표본표준편차★평균편차★기초통계학-[Chapter03 - 04] (0) | 2022.12.02 |
| np.median★절사평균, 중위수★기초통계학-[Chapter03 - 03] (0) | 2022.12.02 |
| ★모평균, 표본평균★중심위치의 척도★기초통계학-[Chapter03 - 01] (0) | 2022.12.01 |