★모평균에 대한 가설 검정★모분산 모를땐 t-분포★신뢰구간 구하기★기초통계학-[연습문제 02 - 11]
2023. 1. 18. 16:37
728x90
반응형
6. 점심시간에 식당가 부근에 있는 공영 주차장에 주차된 승용차의 평균 주차 시간이 1시간을 초과하는지 알아보기 위하여 어느 점심시간에 주차 시간을 조사한 결과 다음과 같았다. 물음에 답하라.
H_0 : 주차시간 <= 60(분) ==> 상단측 검정
1> 평균 주차시간이 1시간을 초과하는지 유의수준 5%에서 조사하라.
X = np.arange(-5,5 , .01)

fig = plt.figure(figsize=(15,8))


#
A = "53 47 68 62 65 65 68 65 64 56 68 76 55 63 56 62 69 60 62 60"
A = list(map(float, A.split(' ')))
print(A)

MEANS = round(np.mean(A) , 4)
STDS = round(np.std(A , ddof =1 ) ,4)
MO_MEAN = 60


n = len(A) #표본개수
dof_2 = [n-1] #자유도c

ax = sns.lineplot(x = X , y=scipy.stats.t(dof_2).pdf(X) )
trust = 95 #신뢰도
trust = round( (1- trust/100) , 4)
t_r =  scipy.stats.t(dof_2).ppf(1- trust)
print(t_r)
t_l = scipy.stats.t(dof_2).ppf(trust)
print(t_l)

E = round(float(t_r * STDS / math.sqrt(n)),4) #오차한계


ax.set_title('상단측검정' , fontsize = 15)
# =========================================================

ax.fill_between(X, scipy.stats.t(dof_2).pdf(X) , 0 , where = (X<=t_r)  , facecolor = 'orange') # x값 , y값 , 0 , X조건 인곳 , 색깔
area = round(float(scipy.stats.t(dof_2).cdf(t_r)),4)


plt.annotate('' , xy=(0, .2), xytext=(-2.5 , .25)  , arrowprops = dict(facecolor = 'black'))
ax.text(-4.6 , .32, f'평균(MEANS) = {MEANS}\n'  +f' n = {n} \n 표준편차(s) = {STDS}\n' +r'오차한계 $e_{%d} = t_{{\alpha}}*\dfrac{s}{\sqrt{n}}$' % ((1-  trust)*100 ) +f'= {E}' ,fontsize=15)

plt.annotate('' , xy=(0, .25), xytext=(1.5 , .25)  , arrowprops = dict(facecolor = 'black'))
ax.text(1.6 , .25, r'$P(t_{%.3f}>T)$' % (trust) + f'= {area}\n' + r'신뢰구간 = ($-\infty, MEANS + e_{\alpha}$)' +f'\n' + r' = $(-\infty, , {%.4f} + {%.4f})$' % ( MEANS , E)  +f'\n' +r'$ = (-\infty, , {%.4f})$' % ( MEANS+E)  ,fontsize=15)

# ax.vlines(x = t_r ,ymin=0 , ymax= scipy.stats.t(dof_2).pdf(t_r) , colors = 'black')
ax.vlines(x = t_r ,ymin=0 , ymax= scipy.stats.t(dof_2).pdf(t_r) , colors = 'black')


# plt.annotate('' , xy=(t_r, .007), xytext=(2.5 , .1)  , arrowprops = dict(facecolor = 'black'))
plt.annotate('' , xy=(t_r, .007), xytext=(2.5 , .1)  , arrowprops = dict(facecolor = 'black'))
# ax.text(1.71 , .13, r'$t_{\dfrac{\alpha}{2}} = {%.4f}$' % t_r + '\n' +r'$\dfrac{\alpha}{2}$ =' + f'{round(float(1- scipy.stats.t(dof_2).cdf(t_r)),3)}',fontsize=15)
ax.text(2.71 , .13, r'$t_{{\alpha}} = {%.4f}$' % t_r + '\n' +r'${\alpha}$ =' +f'{round(float(1- scipy.stats.t(dof_2).cdf(t_r)),3)}',fontsize=15)

ax.text(t_r - 1 , 0.02 , r'$t_r$' + f'= {t_r}'  , fontsize = 13)
# ax.text(t_l + .2 , 0.02 , r'$t_l$' + f'= {t_l}'  , fontsize = 13)


#==================================== 가설 검정 ==========================================


t_1 = round((MEANS - MO_MEAN)/ (STDS / math.sqrt(n)),4)

print(t_1)
t_1 = abs(t_1)
area = round(1- float(scipy.stats.t(dof_2).cdf(t_1) ),4)
ax.fill_between(X, scipy.stats.t(dof_2).pdf(X) , 0 , where =  (X>=t_1) , facecolor = 'skyblue') # x값 , y값 , 0 , X조건 인곳 , 색깔
ax.fill_between(X, scipy.stats.t(dof_2).pdf(X) , 0 , where = (X>=t_r) , facecolor = 'red') # x값 , y값 , 0 , X조건 인곳 , 색깔

ax.vlines(x= t_1, ymin= 0 , ymax= stats.t(dof_2).pdf(t_1) , color = 'green' , linestyle ='solid' , label ='{}'.format(2))
# ax.vlines(x= -t_1, ymin= 0 , ymax= stats.t(dof_2).pdf(-t_1) , color = 'green' , linestyle ='solid' , label ='{}'.format(2))

annotate_len = stats.t(dof_2).pdf(t_1) /2
plt.annotate('' , xy=(t_1, annotate_len), xytext=(-t_1/2 , annotate_len)  , arrowprops = dict(facecolor = 'black'))
# plt.annotate('' , xy=(-t_1, annotate_len), xytext=(t_1/2 , annotate_len)  , arrowprops = dict(facecolor = 'black'))
ax.text(-1.5, annotate_len+0.03 , f'P-value : \nP(T>={t_1}) \n = {area}',fontsize=15)

mo = '모평균'

ax.text(-4.6 , .22, r'T = $\dfrac{\overline{X} - {\mu}}{\dfrac{s}{\sqrt{n}}}$' + f'= { round((MEANS - MO_MEAN)/(STDS / math.sqrt(n)),4) }' ,fontsize=15)


b = ['t-(n={})'.format(i) for i in dof_2]
plt.legend(b , fontsize = 15)
H_0 : m<= 60 (상단측 검정)
p-value : 0.0752
alpha = 0.05
p-value > alpha ==> 0.0752 > 0.05 ==> H_0: m<= 60 채택 ==> 유의수준 5%에서 평균 주차시간이 1시간 이하이다.
7. 자동차 베터리를 판매하는 한 판매상이 자신이 판매하는 배터리의 평균 수명은 36개월을 초과한다고 말한다. 임의로 배터리 10개를 측정하여 평균 37.8개월, 표준편차 4.3개월을 얻었다. 이 자료를 근거로 배터리의 평균 수명이 36개월을 초과하는지 유의수준 5%에서 조사하라.
|X = 37.8
s = 4.3
n = 10
H_0 : m <= 36 (상단측 검정)
X = np.arange(-5,5 , .01)

fig = plt.figure(figsize=(15,8))


#
# A = "53 47 68 62 65 65 68 65 64 56 68 76 55 63 56 62 69 60 62 60"
# A = list(map(float, A.split(' ')))
# print(A)

MEANS = 37.8
STDS = 4.3
MO_MEAN = 36


n = 10 #표본개수
dof_2 = [n-1] #자유도c

ax = sns.lineplot(x = X , y=scipy.stats.t(dof_2).pdf(X) )
trust = 95 #신뢰도
trust = round( (1- trust/100) , 4)
t_r =  scipy.stats.t(dof_2).ppf(1- trust)
print(t_r)
t_l = scipy.stats.t(dof_2).ppf(trust)
print(t_l)

E = round(float(t_r * STDS / math.sqrt(n)),4) #오차한계


ax.set_title('상단측검정' , fontsize = 15)
# =========================================================

ax.fill_between(X, scipy.stats.t(dof_2).pdf(X) , 0 , where = (X<=t_r)  , facecolor = 'orange') # x값 , y값 , 0 , X조건 인곳 , 색깔
area = round(float(scipy.stats.t(dof_2).cdf(t_r)),4)


plt.annotate('' , xy=(0, .2), xytext=(-2.5 , .25)  , arrowprops = dict(facecolor = 'black'))
ax.text(-4.6 , .32, f'평균(MEANS) = {MEANS}\n'  +f' n = {n} \n 표준편차(s) = {STDS}\n' +r'오차한계 $e_{%d} = t_{{\alpha}}*\dfrac{s}{\sqrt{n}}$' % ((1-  trust)*100 ) +f'= {E}' ,fontsize=15)

plt.annotate('' , xy=(0, .25), xytext=(1.5 , .25)  , arrowprops = dict(facecolor = 'black'))
ax.text(1.6 , .25, r'$P(t_{%.3f}>T)$' % (trust) + f'= {area}\n' + r'신뢰구간 = ($-\infty, MEANS + e_{\alpha}$)' +f'\n' + r' = $(-\infty, , {%.4f} + {%.4f})$' % ( MEANS , E)  +f'\n' +r'$ = (-\infty, , {%.4f})$' % ( MEANS+E)  ,fontsize=15)

# ax.vlines(x = t_r ,ymin=0 , ymax= scipy.stats.t(dof_2).pdf(t_r) , colors = 'black')
ax.vlines(x = t_r ,ymin=0 , ymax= scipy.stats.t(dof_2).pdf(t_r) , colors = 'black')


# plt.annotate('' , xy=(t_r, .007), xytext=(2.5 , .1)  , arrowprops = dict(facecolor = 'black'))
plt.annotate('' , xy=(t_r, .007), xytext=(2.5 , .1)  , arrowprops = dict(facecolor = 'black'))
# ax.text(1.71 , .13, r'$t_{\dfrac{\alpha}{2}} = {%.4f}$' % t_r + '\n' +r'$\dfrac{\alpha}{2}$ =' + f'{round(float(1- scipy.stats.t(dof_2).cdf(t_r)),3)}',fontsize=15)
ax.text(2.71 , .13, r'$t_{{\alpha}} = {%.4f}$' % t_r + '\n' +r'${\alpha}$ =' +f'{round(float(1- scipy.stats.t(dof_2).cdf(t_r)),3)}',fontsize=15)

ax.text(t_r - 1 , 0.02 , r'$t_r$' + f'= {t_r}'  , fontsize = 13)
# ax.text(t_l + .2 , 0.02 , r'$t_l$' + f'= {t_l}'  , fontsize = 13)


#==================================== 가설 검정 ==========================================


t_1 = round((MEANS - MO_MEAN)/ (STDS / math.sqrt(n)),4)

print(t_1)
t_1 = abs(t_1)
area = round(1- float(scipy.stats.t(dof_2).cdf(t_1) ),4)
ax.fill_between(X, scipy.stats.t(dof_2).pdf(X) , 0 , where =  (X>=t_1) , facecolor = 'skyblue') # x값 , y값 , 0 , X조건 인곳 , 색깔
ax.fill_between(X, scipy.stats.t(dof_2).pdf(X) , 0 , where = (X>=t_r) , facecolor = 'red') # x값 , y값 , 0 , X조건 인곳 , 색깔

ax.vlines(x= t_1, ymin= 0 , ymax= stats.t(dof_2).pdf(t_1) , color = 'green' , linestyle ='solid' , label ='{}'.format(2))
# ax.vlines(x= -t_1, ymin= 0 , ymax= stats.t(dof_2).pdf(-t_1) , color = 'green' , linestyle ='solid' , label ='{}'.format(2))

annotate_len = stats.t(dof_2).pdf(t_1) /2
plt.annotate('' , xy=(t_1, annotate_len), xytext=(-t_1/2 , annotate_len)  , arrowprops = dict(facecolor = 'black'))
# plt.annotate('' , xy=(-t_1, annotate_len), xytext=(t_1/2 , annotate_len)  , arrowprops = dict(facecolor = 'black'))
ax.text(-1.5, annotate_len+0.03 , f'P-value : \nP(T>={t_1}) \n = {area}',fontsize=15)

mo = '모평균'

ax.text(-4.6 , .22, r'T = $\dfrac{\overline{X} - {\mu}}{\dfrac{s}{\sqrt{n}}}$' + f'= { round((MEANS - MO_MEAN)/(STDS / math.sqrt(n)),4) }' ,fontsize=15)


b = ['t-(n={})'.format(i) for i in dof_2]
plt.legend(b , fontsize = 15)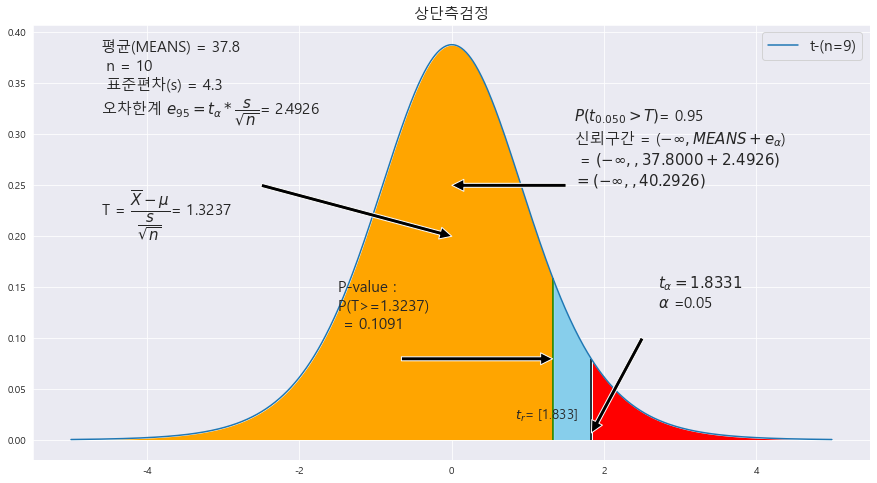
H_0 : m<= 36 (상단측 검정)
p-value : 0.1091
alpha = 0.05
p-value > alpha ==> 0.1091 > 0.05 ==> H_0: m<= 36 채택 ==> 유의수준 5%에서 평균 수명이 36개월을 초과하지 않는다.
728x90
반응형
'기초통계 > 소표본 추론' 카테고리의 다른 글
| ★쌍체 t-검정★기초통계학-[연습문제 04- 13] (0) | 2023.01.19 |
|---|---|
| ★모평균의 차에 대한 가설 검정★모분산 모를땐 t-분포★줄기-잎그림★신뢰구간 구하기★기초통계학-[연습문제 03- 12] (0) | 2023.01.18 |
| ★모평균에 대한 가설 검증★모분산 모를땐 t-분포★신뢰구간 구하기★기초통계학-[연습문제 01 - 10] (0) | 2023.01.18 |
| ★모분산 비에 대한 가설검정★양측검정★기초통계학-[소표본 추론-09] (0) | 2023.01.18 |
| ★모분산 비에 대한 소표본 추론★기초통계학-[소표본 추론-08] (0) | 2023.01.18 |